Predator-Prey Population graphs Cont'd.


Reproduce slow, start higher.

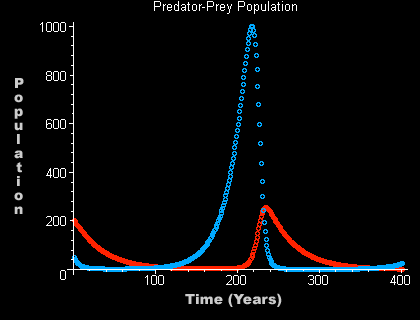
This graph spans 400 years, has an initial prey population 
of 50 and an initial predator population of 200.

P1  = 50     Q1  = 200     n  = 400

      Since the predators seem to take a long time to recover from reproducing at such a low rate, they started here with a higher population than the prey. Looking at the graph will quickly make one realize the problems with this model. About 20 years into the graph, the prey become extinct. But since there was enough time given where the predators did still exist, the prey had time to bounce back. While the predators were extinct, the prey grew exponentially. This simply imitates the previous graphs of the animals in isolation.


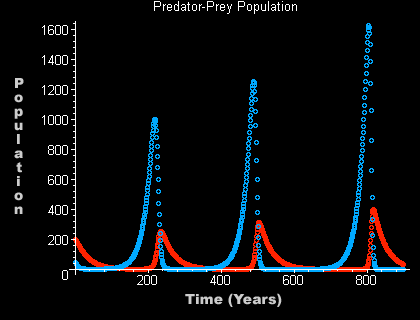
This graph spans 900 years, has an initial prey
 population of 50 and an initial predator population of 200.

P1 = 50      Q1 = 200      n = 900

Further into the future was viewed. If this model was possible, it would repeat and rise. It is interesting to see that there are patterns to population model if the variables repeat, but at the same time, the pattern is more complex than mere repetition. As mentioned, the population also maximum increases with each cycle.


Intro    Pred-Prey Graphs    Phase Plots    Equilibrium Points    Conclusion&Error

© 2000 -  Horowitz & Joshi