Constructing Slope Fields in Maple
The first step is to call the "DEtools" and "plots" packages.
| > |
There many commands in Maple that you can use to draw slope fields for differential equations. Feel free to use Google or the Maple Help center to find out about the different commands. For simplicity and consistency, we'll focus on one command for now.
We will primarily use the "DEplot" command to draw slope fields in Maple, as it enables us to easily add solution curves with various initial conditions to the slope field. First, we must define the differential equation that we want to plot. I've called the differential equation "diffeq", but you can rename it to anything that you like. "diff(y(t),t)" means the first derivative of the function y(t) with respect to t. To get a second derivative, type "diff(y(t),t,t)".
| > |
| (1) |
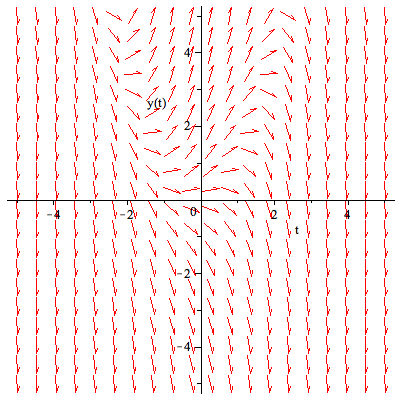
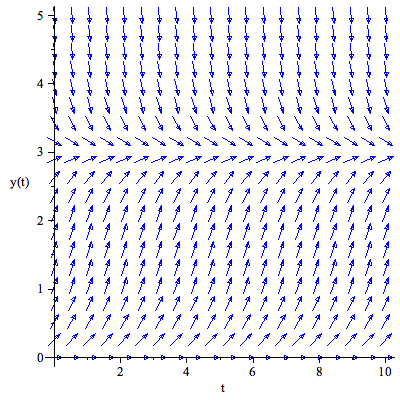
Next, use the "DEplot" command to genereate a slope field of the differential equation "diffeq". You can change the axes and the color of the plot as necessary. For more information about the DEplot command, and to find out what kinds of other options are available, type ?DEplot in Maple, or use the Maple Help center.
| > |
| > |
 |
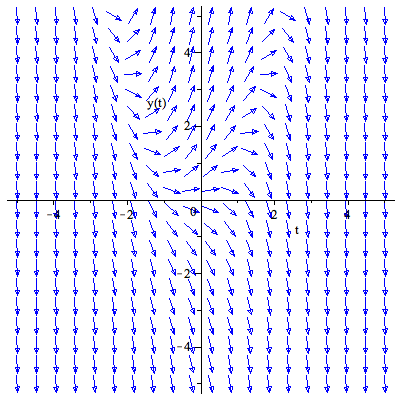
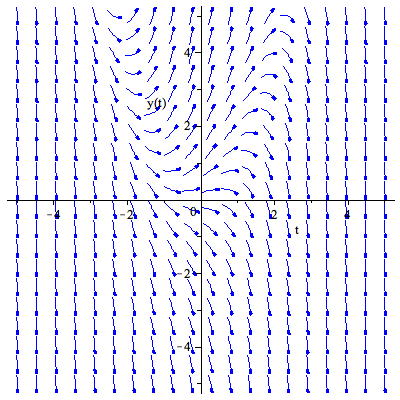
You can add arrows to make the slope field easier to visualize. You can set the size and type of the arrows, as described in Maple Help.
| > |
 |
| > |
 |
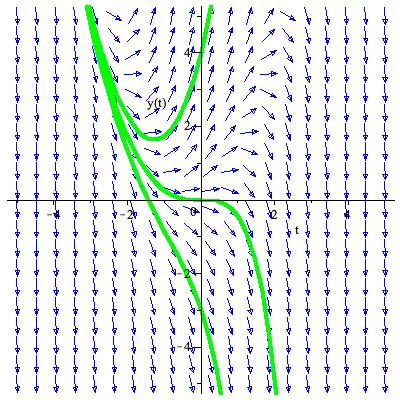
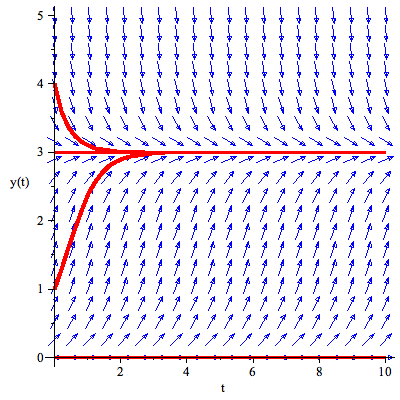
You can add solution curves with different initial conditions as shown below.
| > |
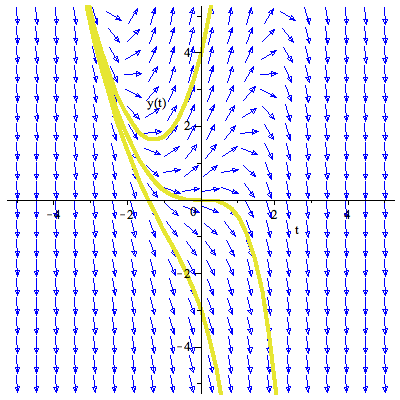 |
The "linecolor" option changes the color of the solution curves.
| > |
 |
| > |
| (2) |
| > |
 |
| > |
 |
| > |